Description
Changing the parameters of sharex, sharey do not work for geographic plot.
Thanks always.
Steps to reproduce
import proplot as plot

fig, axs = plot.subplots(ncols=2, nrows=2, proj='cyl', share=3)
axs.format(coast=True, labels=True)
Actual behavior: [What actually happened]
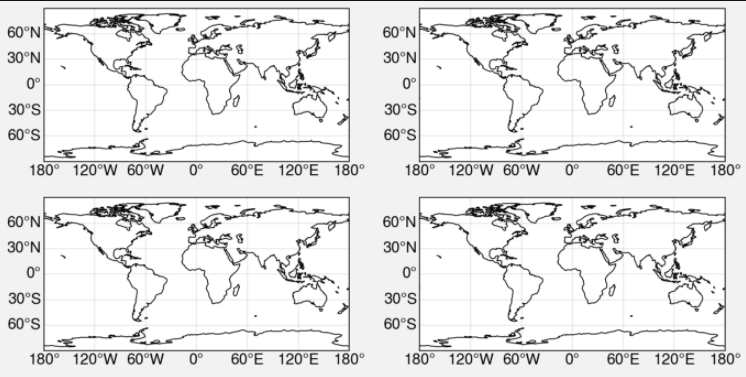
Equivalent steps in matplotlib
import numpy as np
import matplotlib.pyplot as plt
import cartopy.crs as ccrs
from cartopy.mpl.ticker import LongitudeFormatter, LatitudeFormatter

fig, axes = plt.subplots(2, 2, sharex=True, sharey=True,
                subplot_kw=dict(projection=ccrs.PlateCarree()))

xticks = np.linspace(-180, 180, 7)
yticks = np.linspace(-90, 90, 7)
for ax in axes.flat:
    ax.coastlines()
    ax.gridlines(xlocs=xticks, ylocs=yticks, linestyle='--', alpha=0.5)
    ax.set_xticks(xticks, crs=ccrs.PlateCarree())
    ax.set_yticks(yticks, crs=ccrs.PlateCarree())
    ax.xaxis.set_major_formatter(LongitudeFormatter(zero_direction_label=True))
    ax.yaxis.set_major_formatter(LatitudeFormatter())
Proplot version
0.6.4
Description
Changing the parameters of sharex, sharey do not work for geographic plot.
Thanks always.
Steps to reproduce
Actual behavior: [What actually happened]

Equivalent steps in matplotlib
Proplot version
0.6.4